Echoing what Carl Sagan wrote in Cosmos, Earth is such an interesting place to live in. Phenomena on Earth are predictable to some degree, but they keep surprising us with their unpredictable nature. Hence, there is always room for both science and mystery. At Meta Lab, we bring that value into practice by harnessing data in any form to understand patterns in many aspects of our lives.
On one hand, we can predict many things with science, in general, with statistics, and machine learning, in particular. Stock market, population, electricity demand, weather, the list goes on. We construct models based on what happened in the past and/or other factors that we believe have moderate to strong relations with the phenomenon we’re interested in. This should make us feel empowered and prepared.
But there are always parts of the phenomenon that seem to be random to our human eyes, have no patterns, nothing can explain where they come from. There’s no choice other than to keep them as an error term in our model. In many cases, we can improve our model. In other cases, few things are indeed unexplainable, even unpredictable. This should remind us to keep in awe of life.
“Garbage In, Garbage Out” or Anything Else?
By building some statistical and machine learning models, we are in the business of trying to understand how certain phenomena have been behaving. At the end of the day, our goal may include the ability to predict how they will behave in the future based on those models. Building a model is one thing. But whether or not that model can represent a phenomenon well, and thus give an accurate prediction, is another thing.
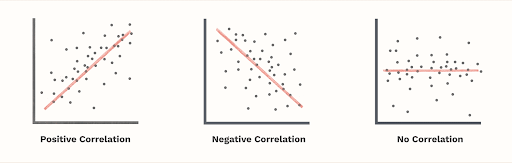
Let’s begin with the most basic. Correlation is a statistical measurement of the degree to which two phenomena are related to each other. We don’t really consider correlation as a modeling technique but discussing correlation first is a good starting point. We can represent the relationship between two variables graphically using scatter plots. The image below shows what positive, negative, and no correlation generally and ideally looks like in a scatter plot.
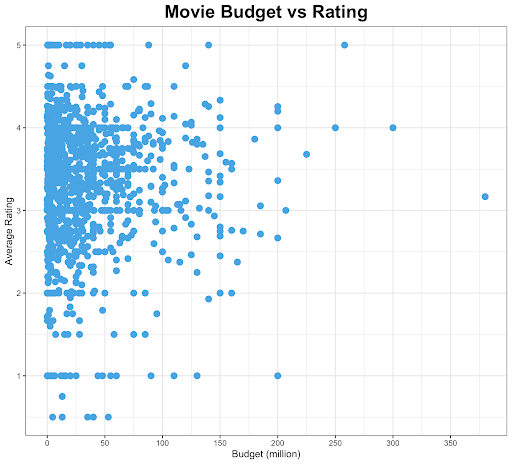
To illustrate, here’s an interesting daily life example. Because who doesn’t like watching movies? One hypothesis we may want to investigate is whether the budget to make a movie is related to our satisfaction towards that movie, which is measured by a one-to-five star rating. The movie dataset is publicly available through the Kaggle website. Out of 45,466 movie titles, we take 1263 titles with at least one user rating and non-zero budget (I know, we missed a lot here!). We then compute the average rating for each of the 1263 titles, and plot the budget against the average rating.
What do we see in the graph below? You see that it’s not as straightforward as the general and ideal cases shown in the previous image. If we took this graph literally, would we say there’s no correlation between the movie budget and the average rating?
I can offer at least four possibilities of why we see what we see in the above graph.
- Not enough evidence to support our hypothesis
This is a less frank way to say “your hypothesis is wrong”. But, I think this is also the “safe” way to say it. Right now, with the current data, we don’t have enough evidence. But who knows if we have more data in the future?
- Garbage in, garbage out
Well, we can always blame the data incompleteness, the data quality, and bla bla bla. In some cases, this is true. We need more good data to confirm our hypothesis or, at least, to be more convinced even if there’s no correlation between two phenomena that we’re interested in.
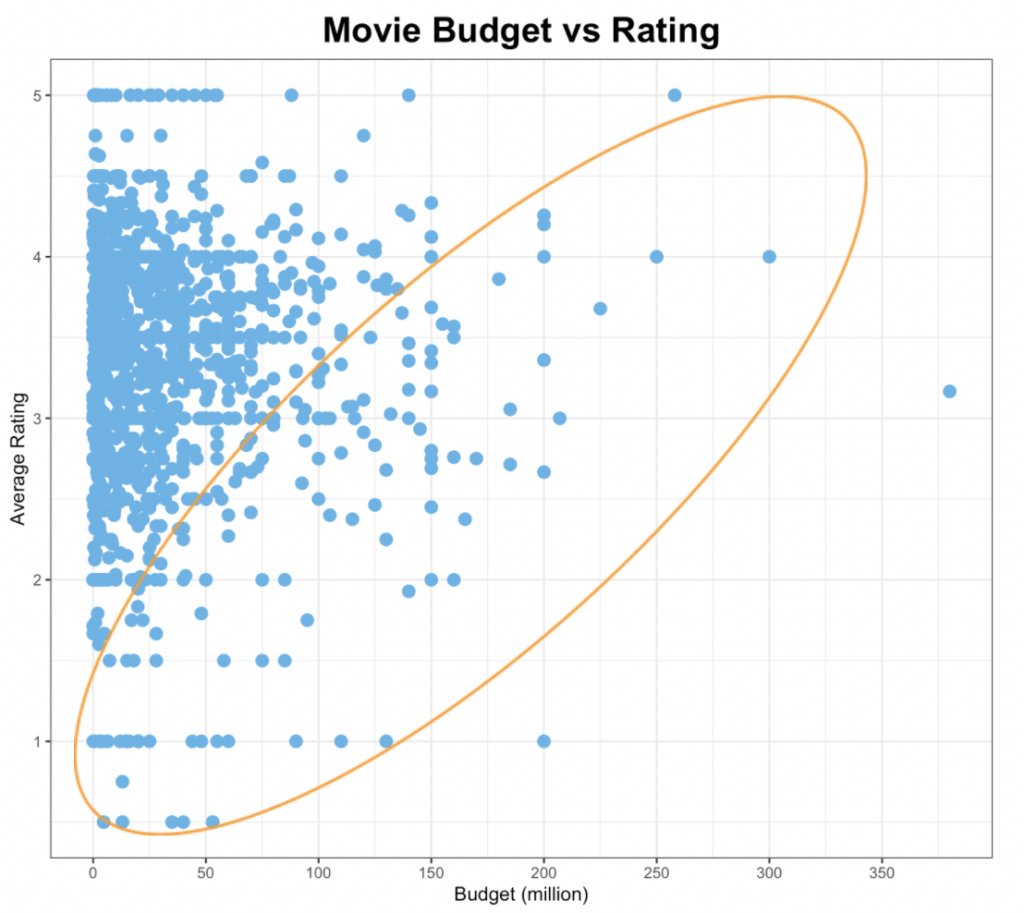
- Hidden pattern
Meaning, our hypothesis is not wrong for a certain group of samples. What if we focus on those inside the orange circle? Do we see that there’s a positive correlation between the budget and the average rating for those titles? This means that we may want to do further investigation, which may lead us to reach a different conclusion.
- Mediating variables
It may be the case that there are other variables that mediate the relationship between the movie budget and the average rating. At least, for many phenomena, this is the case. For our movie example, it could be this relationship also depends on the type of movie, the actors who are in the movie, the music score, the director, and so on.
What Causes What?
Correlation doesn’t equal causation. Does spending more money to make a movie end up with a high-quality movie, and thus receive higher ratings? Correlation analysis doesn’t answer such a question. Advancing from correlation analysis, we have regression analysis. Regression analysis allows us to quantify how a particular variable affects an outcome of interest while also controlling for other variables.
I didn’t want to write a long post, and this already takes more pages than I expected. Let’s call this Part I of “A Semi-Poetic Intro to Statistical Modelling”. In Part II, we’ll get into the discussion and the implementation of (linear) regression analysis using the same dataset. We’ll also see that linear assumption won’t always be suitable for many real-world problems. This way, we’ll complete the “introduction” in a two-part post. We need to get exposed to the basics before diving into the complex ones, right?
“If we lived on a planet where nothing ever changed, there would be little to do. There would be nothing to figure out. There would be no impetus for science. And if we lived in an unpredictable world, where things changed in random or very complex ways, we would not be able to figure things out. But we live in an in-between universe, where things change, but according to patterns, rules, or as we call them, laws of nature. If I throw a stick up in the air, it always falls down. If the sun sets in the west, it always rises again the next morning in the east. And so it becomes possible to figure things out. We can do science, and with it we can improve our lives.”
— Carl Sagan (Cosmos)